background
Ceedling is a (rightly) widespread and in Ruby developed build system for C projects. Together with Unity and CMock It is often used in embedded software development. After a certain training period, Unit tests usually created quite quickly. Ideally, the tests are created together with the actual implementation. (I won't go into test-driven development in detail here, though.)
However, it does happen from time to time that a test “crashes” – in other words, it fails without a trace due to an exception.
Here is an example of such an unhelpful error message:
Linking test_adcCtrl.out…
Running test_adcCtrl.out…ERROR: Test executable “test_adcCtrl.out” failed.
> Produced no output to $stdout.
> And exited with status: [0] (count of failed tests).
> This is often a symptom of a bad memory access in source or test code.rake aborted!
C:/testprj/tools/vendor/ceedling/lib/ceedling/generator_helper.rb:36:in `test_results_error_handler'
C:/testprj/tools/vendor/ceedling/lib/ceedling/generator.rb:173:in `generate_test_results'
C:/testprj/tools/vendor/ceedling/lib/ceedling/rules_tests.rake:55:in `block in '
C:/testprj/tools/vendor/ceedling/lib/ceedling/task_invoker.rb:107:in `invoke_test_results'
C:/testprj/tools/vendor/ceedling/lib/ceedling/test_invoker.rb:124:in `block in setup_and_invoke'
C:/testprj/tools/vendor/ceedling/lib/ceedling/test_invoker.rb:51:in `each'
C:/testprj/tools/vendor/ceedling/lib/ceedling/test_invoker.rb:51:in `setup_and_invoke'
C:/testprj/tools/vendor/ceedling/lib/ceedling/rules_tests.rake:70:in `block (2 levels) in '
../../tools/vendor/ceedling/bin/ceedling:346:in `block in'
../../tools/vendor/ceedling/bin/ceedling:333:in `'
Tasks: TOP => build/test/results/test_adcCtrl.pass
(See full trace by running task with –trace)
The cause can be, for example, calls to SDK functions that access hardware addresses, which, of course, don't exist in the simulation. In such cases, finding the cause of the error without further analysis options can result in lengthy printf debugging. That's not exactly nice!
A notice: In the following, I assume that unit tests (under Windows) are already running with Ceedling; there are good instructions for setting up Ceedling ;-)
We use in various projects Ruby with DevTools (Ruby installation https://rubyinstaller.org/downloads/, e.g. rubyinstaller-devkit-2.7.5-1-x86.exe). The compiler gcc comes with the MSYS2 tools (https://www.msys2.org/) and is already included.
Back to the roots: gdb
It has been a very long time since I used the GNU Debugger gdb I used it directly. For application debugging, you usually use an IDE (Segger/CubeIDE) or another graphical debugger frontend (xgdb, DDD, KDbg, etc.) to avoid making life unnecessarily difficult.
If you use Cygwin, you'll usually already have gdb installed. If you use Ruby with MSYS2, you'll need to install gdb as an optional package. You'll find tips at the end ("MSYS2 gdb Installation").
The old-school version to find the cause of a test crash is
- Open a console (cmd) and start gdb with the absolute path to the test executable:
C:\testprj\scripts>gdb C:\testprj\Unittest\build\test\out\test_adcCtrl.out
- gdb loads the executable and reads the symbol information it contains:
Reading symbols from C:\testprj\Unittest\build\test\out\test_adcCtrl.out…
(gdb) - With “run” (or “r” for short) you start the executable:
(gdb) rStarting program: C:\tesprj\Unittest\build\test\out\test_adcCtrl.out
[New Thread 29368.0x700c]Thread 1 received signal SIGSEGV, segmentation fault.
test_adcCtrl_daqComplete () at test/test_adcCtrl.c:68
68 adc_handler.Instance->CR = 0xFF;(gdb) - If you want to be a bit more precise – you can get the stack trace using “where”:
(gdb) where
#0 test_adcCtrl_daqComplete () at test/test_adcCtrl.c:68
#1 0x00f816f0 in run_test (func=0xf818b4 , name=0xfc8053 "test_adcCtrl_daqComplete", line_num=57) at build/test/runners/test_adcCtrl_runner.c:93
#2 0x00f81755 in main () at build/test/runners/test_adcCtrl_runner.c:109(gdb)
With this information, you can usually get a lot further. (In this specific case, the application code accesses a pointer in the data structure ADC_HandleTypeDef to – and that is NULL).
A little more comfort please
Hardcore gdb-ing is fine—but as you get older, you like things a little more comfortable. As an occasional VS Code user, it was a logical step to search for a plug-in that supports the Ceedling unit testing workflow. I came across several blog posts and other resources. At the end of the article, you'll find a list of the sources used. The gist of it is summarized in this article.
Now we're going to look at the ingredients needed to debug a test case – as conveniently as possible.
VS Code – more than an editor
VS Code is an open-source project (MIT license) and is sometimes used solely as an editor. However, this doesn't really cover its full potential. With its numerous extensions, it quickly becomes a jack of all trades—and in this case, a "Ceedling IDE" :-)
installation
The following tools are required
- VS Code (https://code.visualstudio.com/download – I use the 64-bit version)
- The VS Code extensions
- Ceedling Test Explorer: Starts Ceedling and the generated test runners in the background, parses their output, lists the test cases, …
- C/C++ : Necessary for debugging (setting breakpoints, single stepping, etc.)
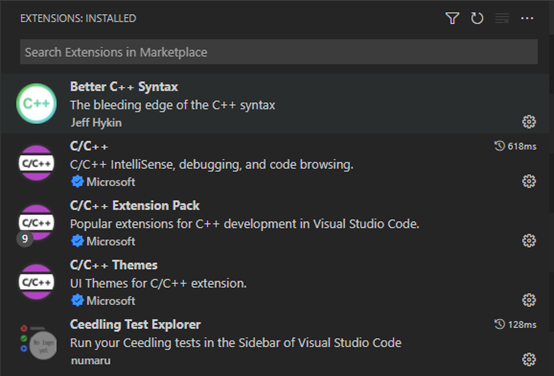
At the end of the blog you will find a list of installed plug-ins.
- gdb – the GNU debugger. As mentioned at the beginning, it's usually included in a Cygwin toolchain. If you use MSYS, things can get tricky. At the end, you'll find two links that helped me install gdb.
Installation shouldn't be difficult. If it is, please let me know.
Bringing everything together
- First, open the directory in VC Code where the project.yaml is located: File -> Open Folder or in the “Explorer View”
- A “launch” configuration must first be created for this “workspace”.
To do this, switch to the “RunView": On the "Activity Bar” (on the left side of the window) click on the Run icon (triangle with a beetle). Now click on “create a launch.json file„.
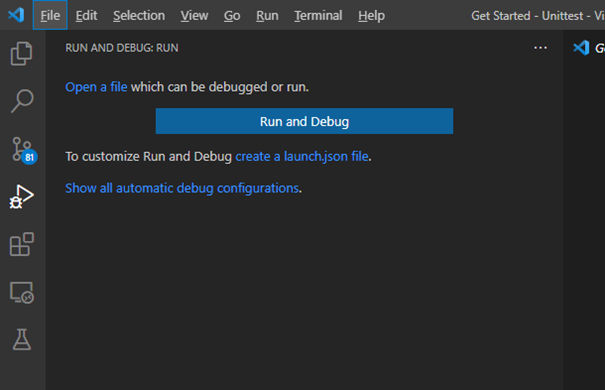
A selection list with various configuration options will appear. You can select any option. It doesn't matter, because the contents of the directory .vscode We replace the generated file with the following. - The following text – the so-called Launch configuration – copy into the opened launch.json file:
{ "version": "0.2.0", "configurations": [ { "name": "ceedlingExplorer", "type": "cppdbg", "request": "launch", "program": "${workspaceFolder}/build/test/out/${command:ceedlingExplorer.debugTestExecutable}", "args": [], "stopAtEntry": false, "cwd": "${workspaceFolder}", "environment": [], "externalConsole": false, "MIMode": "gdb", "miDebuggerPath": "gdb.exe", "setupCommands": [ { "description": "Enable pretty-printing for gdb", "text": "-enable-pretty-printing", "ignoreFailures": true } ], "debugConfiguration": { "description": "Debug configuration to run during test debug.", "type": "string", "scope": "resource" }, "problemMatching": { "mode": "gcc" } } ] }With the configuration you tell the Ceedling Test Explorer with
-
- where the test sources are located.
You may need to adjust the path “build/test/out” in the “program” entry to match your Ceedling configuration (see project.yml). - which debugger should be used.
To do this, you'll need to adjust the miDebuggerPath parameter to your build environment. If gdb.exe isn't in the search path, you can also specify an absolute path, for example:
"miDebuggerPath": "C:/Ruby27/msys32/mingw32/bin/gdb.exe„,
- where the test sources are located.
The other parameters usually do not need to be touched.
-
- In the VS Code-Settings (via File->Preferences->Settings) under “Extensions > Ceedling Test Explorer configuration” the name of the configuration as specified in Launch.json must be entered:
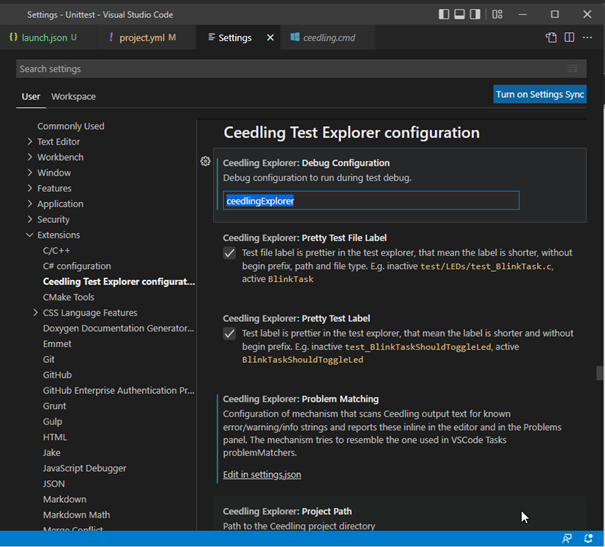
- In order for the Ceedling Test Explorer to parse the test output, the plug-in “xml_test_report” must be added to the project file project.yml:
:load_paths: - ../../tools/vendor/ceedling/plugins :enabled: - stdout_pretty_tests_report - xml_tests_report
- Now switch to the “Test” view, click on “Refresh” (second icon next to “TESTING”) – and voila :-)
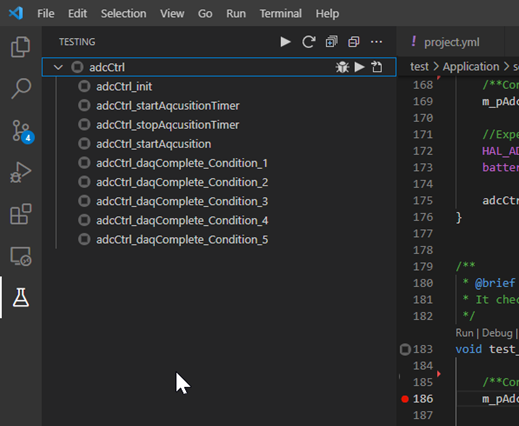
All test cases are then listed.
Now you can edit the test, run tests, set breakpoints, and debug just like in any other IDE. What more could you want!
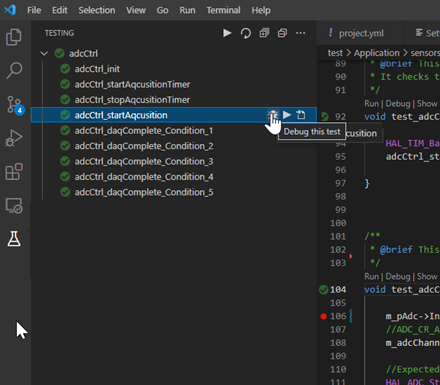
There is currently one limitation: You can't (yet?) run or debug individual test cases of a unit test separately. So, if you want to debug a test case, you must first set a breakpoint there and then click the bug button ("Debug this test").
If you have any questions or suggestions, please leave a comment. I'll be happy to help.
References
MSYS2 gdb installation:
- Installing GDB: An older Ruby/MSYS2 installation had stubbornly refused to install a package. With Ruby27+MSYS2, this was no problem. Simply launch the MSYS32 console (in my case, msys2.exe in the directory C:\Ruby27\msys32) and by means of pacman -S gdb becomes gdb installed.
Here are further instructions: https://gist.github.com/bd2357/b2d69ab18849c1e2f70959eef426ff09
Note: You can easily install the 64-bit version of gdb (mingw64/mingw-w64-x86_64-gdb) as described in the manual, even if you are using the 32-bit version of Ruby/MSYS2. - Problems with signatures: https://github.com/msys2/MSYS2-packages/issues/2343
Left:
- Install gdb for MSYS: https://gist.github.com/bd2357/b2d69ab18849c1e2f70959eef426ff09
VS Code plugins
